
12 Best Data Visualization Platforms for Analytics in 2026, Compared
Compare the 12 best data visualization platform for analytics options on price, free plans and AI features, with prices checked November 12, 2026.
 Shamim Mia, Founder, SerpAstraLast verified November 12, 202613 min read
We compare pricing pages, documentation and public reviews. We never accept payment for rankings.

Key takeaways
- Tableau leads for depth at $75 per Creator a month; Microsoft Power BI is the best-value paid plan at $14 a user a month; Looker Studio is free.
- The pricing unit matters more than the sticker price: per-user tools stay cheap while the team is small, flat tools (Qlik, Klipfolio) are easiest to budget, and four tools publish no price at all.
- Every tool here refreshes data at least daily on the entry plan, but AI features are only included on 8 of the 12 entry plans — check before you pay for AI.
- All prices were checked on the vendors' own pricing pages on November 12, 2026; ratings are from G2 reviews pages checked the same day.
On this page
Quick comparison
| Tool | Best for | Starting price | Free plan |
|---|---|---|---|
| Tableau | Data teams and analysts who need the deepest visual analytics and are willing to pay per role | $75/user/mo | No (14-day trial) |
| Microsoft Power BI | Teams already on Microsoft 365 who want capable dashboards at the lowest per-user price | $14/user/mo | Yes (free account) |
| Looker Studio | Small teams reporting on Google data (GA4, Ads, Search Console, Sheets) who want to pay $0 | Free; Pro $9/mo | Yes (free plan) |
| Qlik Sense | Mid-size teams that need governed analytics with a shared data model for up to 10 people | $300/mo | No (30-day trial) |
| Zoho Analytics | Small businesses already using Zoho apps that want cheap AI-assisted reporting | $30/mo | Yes (free plan) |
| Databox | Marketing teams and agencies that need KPI dashboards and client reports from 130+ sources | $89/mo | Yes (free plan) |
| Klipfolio | Small teams that want flat-priced operational dashboards shared with unlimited users | $140/mo | No (14-day trial) |
| Metabase | Data teams that want an open-source BI tool they can self-host or run in the cloud | $100/mo | Yes (open source) |
| ThoughtSpot | Data teams whose business users want to ask questions in plain English and get charts back | Custom quote | No (trial only) |
| Domo | Mid-size and enterprise teams that want ETL, warehousing and dashboards in one cloud platform | Custom quote | No (30-day trial) |
| Sisense | SaaS product teams that need to embed white-labeled analytics inside their own application | Custom quote | No (7-day trial) |
| Looker | Enterprises that need one governed semantic layer (LookML) behind every dashboard | Custom quote | No (trial only) |
Make one of these tools?
We re-check this list every quarter. Send a correction, request a review, or ask about a clearly labeled sponsored spot.
Request a listingThe best data visualization platform for analytics

Tableau
Best for: Data teams and analysts who need the deepest visual analytics and are willing to pay per role
Tableau is the tool other tools are compared against. Its charting is the most flexible in this list: you can build almost any visual, from small multiples to custom maps, and the formatting controls are precise enough for client-ready reports. Tableau Cloud publishes dashboards that viewers can filter, drill into and export without asking an analyst for help.
The price is per role, and that is where teams get caught. Creator licences start at $75 a user a month billed annually, Explorer is $42 and Viewer is $15, and every plan needs an annual contract. Tableau Pulse, the AI feature that explains metric changes in plain language, is included on the Standard plan. If your team has several authors, budget the roles before you buy — the tool is worth the price only if people use it daily.
What we like
- The deepest charting and formatting controls of any tool here
- A large community and a huge library of templates and how-to content
- Native live connectors to almost every database and warehouse
- Tableau Pulse puts plain-language metric explanations in front of viewers
Watch out for
- Creator licences start at $75 a user a month, so a team of authors adds up fast
- Viewers pay $15 a month, so even read-only seats are not free
- The desktop app and the cloud service have separate learning curves

Microsoft Power BI
Best for: Teams already on Microsoft 365 who want capable dashboards at the lowest per-user price
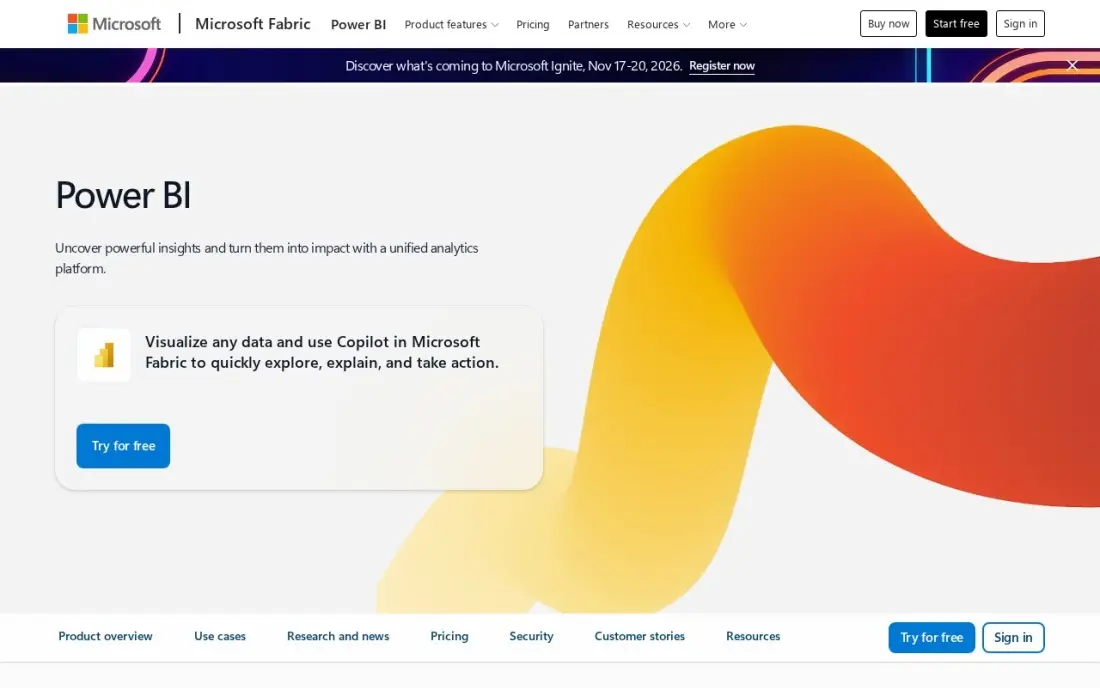
Power BI is the value pick in this list. Pro costs $14 a user a month paid yearly — the lowest per-user price of any paid plan here — and it is a capable dashboard tool: 8 scheduled refreshes a day, 10 GB storage per licence and native connectors to Excel, SharePoint and most databases. If your team lives in Microsoft 365, the Teams and Outlook integration makes adoption easy.
The free account lets you build reports locally, but sharing them needs Pro, so a team of 10 pays $140 a month. Copilot AI features are not included on Pro — they need a separate Fabric capacity — and paginated reports need the $24 Premium Per User tier. For a small or mid-size team that wants real dashboards without a big bill, Power BI is the first tool to trial.
What we like
- The lowest per-user price of any paid plan here: $14 a user a month
- Native integration with Microsoft 365, Teams and Excel
- 8 scheduled refreshes a day and 10 GB storage on Pro
- A free account lets you build locally before you pay
Watch out for
- Sharing reports needs Pro, so a free account alone is not a team solution
- Copilot AI features need a separate Fabric capacity, not Pro
- Some advanced visuals and paginated reports need the $24 Premium Per User tier

Looker Studio
Best for: Small teams reporting on Google data (GA4, Ads, Search Console, Sheets) who want to pay $0
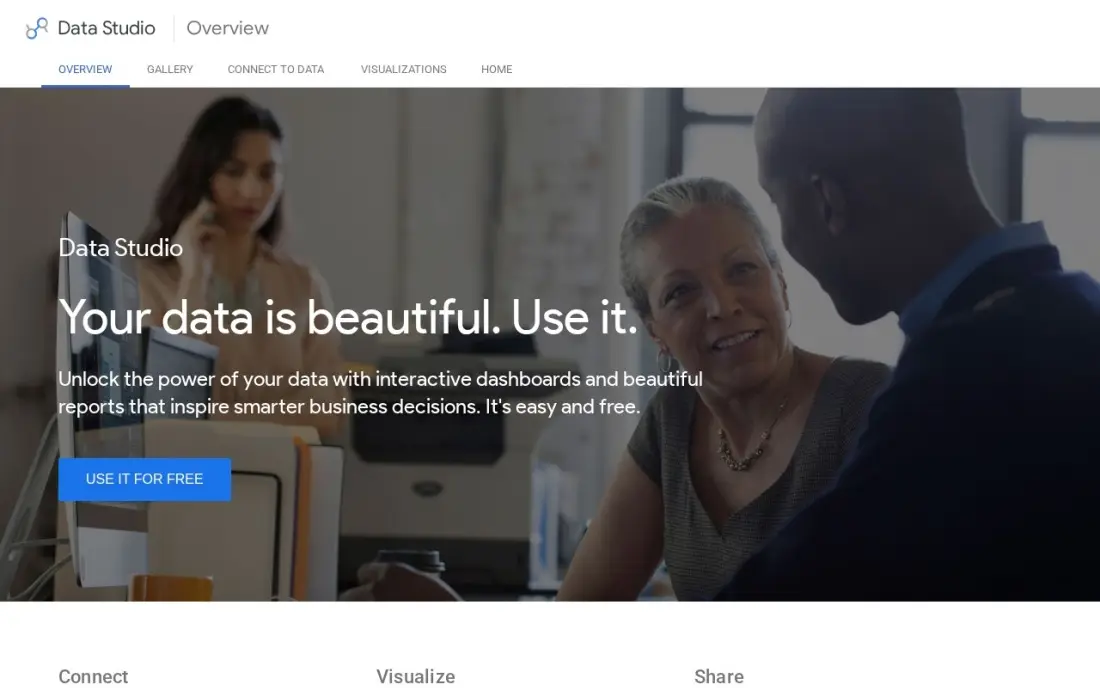
Looker Studio is the only free dashboard tool in this list: $0, unlimited reports, no user cap, and sharing is a link. It is the simplest way to report on Google Analytics 4, Google Ads, Search Console and Sheets, and its 23 native Google connectors cover the data most small teams use. Over 1,000 community connectors extend it beyond Google data.
The free plan has limits worth knowing: AI features (Gemini in Looker Studio) are Pro-only at $9 a user per project a month, and there is no scheduled email delivery of dashboards on the free plan. Google renamed the product back to Data Studio in April 2026, which is why its G2 page is listed under Data Studio — the product is the same free tool. For a small team reporting on Google data, start here.
What we like
- Free, with unlimited reports and no user cap
- The simplest way to report on GA4, Google Ads and Search Console
- Over 1,000 community connectors extend it well beyond Google data
- Sharing is a link, so viewers need no licence at all
Watch out for
- AI features (Gemini in Looker Studio) are Pro-only, not on the free plan
- No scheduled email delivery of dashboards on the free plan
- Performance can slow down on very large or heavily blended data

Qlik Sense
Best for: Mid-size teams that need governed analytics with a shared data model for up to 10 people
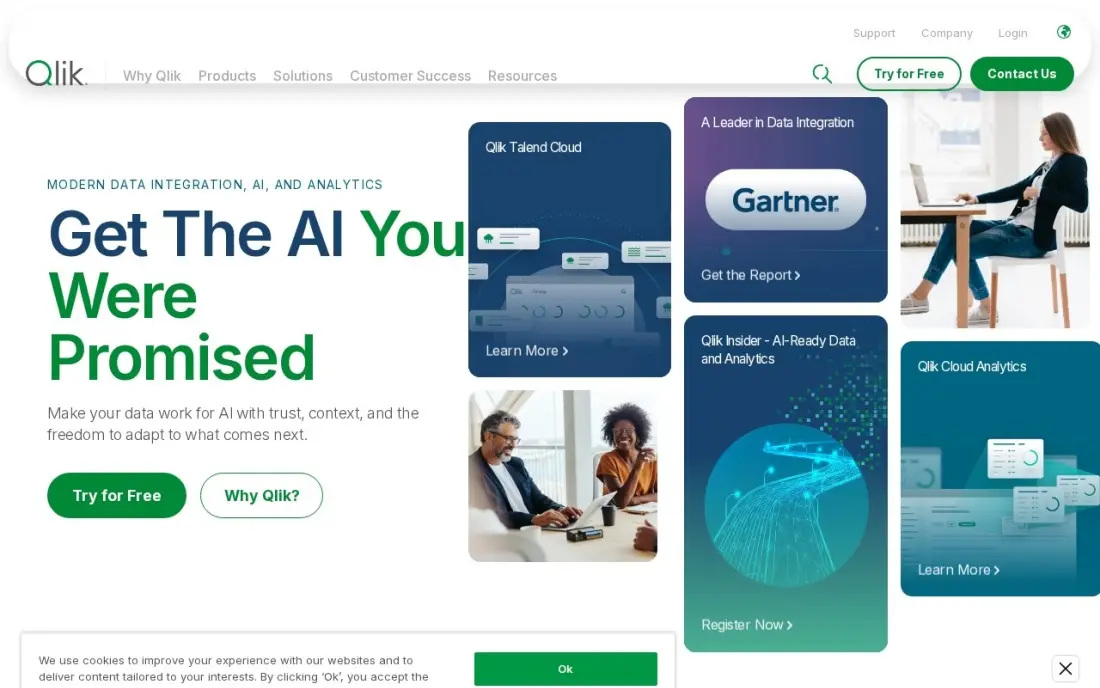
Qlik Sense is the governed option for mid-size teams. Starter costs $300 a month billed annually and covers 10 users and 10 GB of data, so the bill is one flat number you can budget a year ahead. Its associative engine lets users click through data in any direction without waiting for a prebuilt query, and the AI features — including Answers Agents — are included on the entry plan.
The trade-off is the learning curve: Qlik's interface takes longer to learn than Looker Studio or Power BI, and the entry plan caps both users and data at 10. Anonymous public sharing needs the $2,750 Premium tier, so if you publish dashboards to the open web, budget for that. For a team of up to 10 that needs one governed view of the numbers, Qlik is the flat-priced pick.
What we like
- A flat $300 a month covers 10 users, so the cost is easy to budget
- The associative engine lets users explore in any direction without prebuilt queries
- Answers Agents bring AI chat to the entry plan
- Hundreds of connectors and a strong governance model
Watch out for
- The entry plan caps data at 10 GB and users at 10
- The interface has a steeper learning curve than Looker Studio or Power BI
- Anonymous public sharing needs the $2,750 Premium tier

Zoho Analytics
Best for: Small businesses already using Zoho apps that want cheap AI-assisted reporting
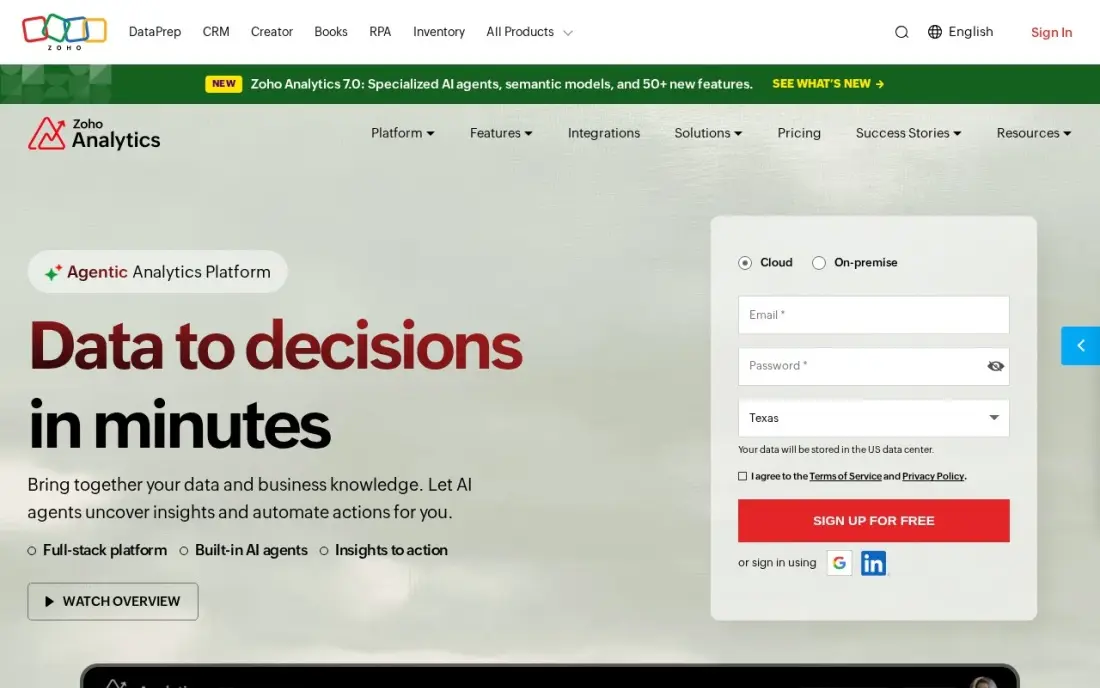
Zoho Analytics is the cheapest way to get an AI assistant. Ask Zia is included on every plan, including the free one, which covers 2 users and 10,000 rows with no time limit. Basic costs $30 a month billed monthly or $24 billed annually for 2 users and 0.5M rows, and the integration with Zoho CRM makes it the natural pick for teams already running Zoho apps.
The limits are the row caps and the refresh rate: Basic syncs once a day, which is fine for a weekly report but slow for a live sales board, and white-label branding needs the Premium plan. A 10-person team needs Standard at $48 a month billed annually for 5 users plus extra users at $6.40 each. For a small business that wants AI-assisted reporting on a small budget, Zoho is hard to beat.
What we like
- Ask Zia AI assistant is included on every plan, including the free one
- The free plan covers 2 users and 10,000 rows with no time limit
- Basic is $24 a month billed annually, one of the cheapest paid plans here
- Deep integration with Zoho CRM and the rest of the Zoho suite
Watch out for
- The free and Basic plans cap data at 10,000 and 0.5M rows
- Syncs run once a day on Basic, which can feel slow next to tools with hourly refresh
- White-label branding needs the Premium plan

Databox
Best for: Marketing teams and agencies that need KPI dashboards and client reports from 130+ sources
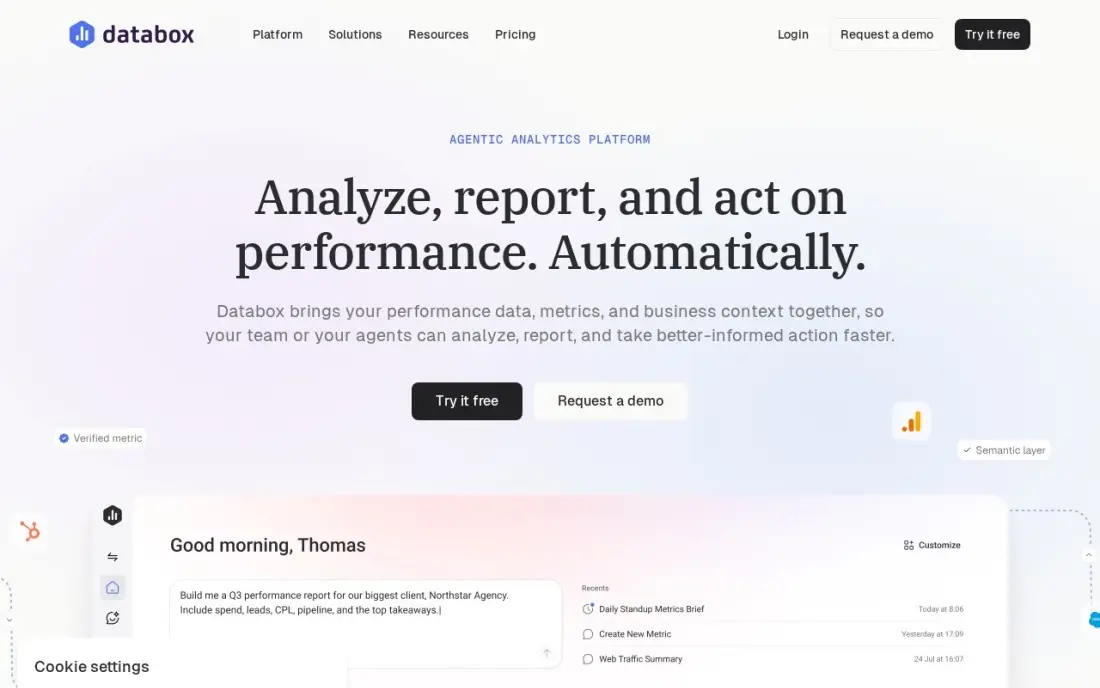
Databox is built for one job: KPI dashboards. Its free plan covers 1 user and 3 data sources, and Genie AI Analyst — the tool that explains what changed in your metrics — is available even on the free plan. With 130+ connectors for marketing, sales and support tools, it is the fastest way to put a live revenue or campaign dashboard on a TV in the office.
The Analyst plan is $89 a month billed monthly or $71 billed annually, but it covers only 1 user and 5 sources — a 10-person team needs Team Scale at $319 a month billed annually. White-label client dashboards are a $200 a month add-on, so agencies should budget for that. If you need KPI tracking and client reports more than deep ad-hoc analysis, Databox is the specialist pick.
What we like
- A free plan with 3 data sources and 50 AI credits a month
- Genie AI Analyst is available even on the free plan
- 130+ connectors built for marketing and sales KPIs
- Scorecards and mobile alerts keep metrics in front of the team
Watch out for
- Analyst covers 1 user and 5 sources, so a team of 10 needs the $319 Team Scale plan
- White-label client dashboards are a $200 a month add-on
- It is built for KPI tracking, not for deep ad-hoc analysis

Klipfolio
Best for: Small teams that want flat-priced operational dashboards shared with unlimited users
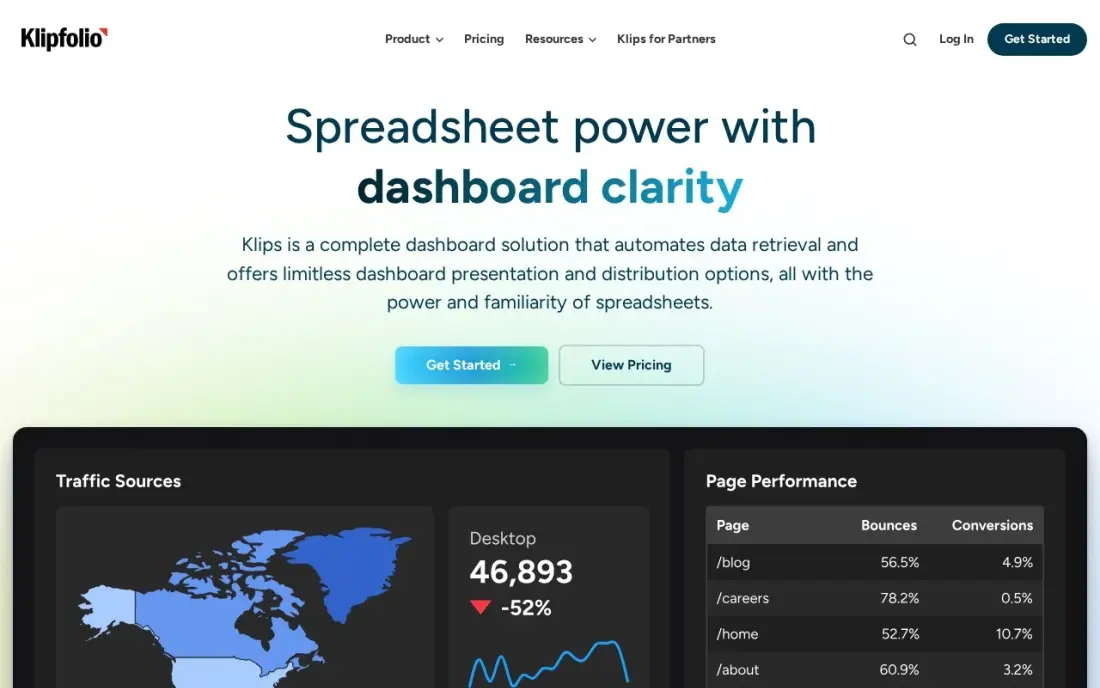
Klipfolio charges one flat price no matter how many people look at the dashboards. Base costs $140 a month billed monthly or $120 billed annually, covers unlimited users and includes all 130+ connectors, and you can put your own logo on dashboards without paying extra — one of only two tools here with white-label branding on the entry plan. The builder is simple enough for non-technical users to learn in an afternoon.
The limits are the dashboard count and the refresh rate: Base allows only 3 dashboards and refreshes data every 4 hours, not on demand. The AI analyst is listed as coming soon, so do not buy Klipfolio for AI features today. For a small team that wants flat-priced operational dashboards shared with everyone, Klipfolio is the straightforward pick.
What we like
- Flat pricing: $120 a month billed annually for unlimited users
- Your own logo on dashboards is included on the Base plan
- 130+ connectors and a formula bar for custom metrics
- A simple builder that non-technical users can learn quickly
Watch out for
- Base allows only 3 dashboards
- The AI analyst is listed as coming soon, not shipped
- Data refreshes every 4 hours on Base, not on demand

Metabase
Best for: Data teams that want an open-source BI tool they can self-host or run in the cloud
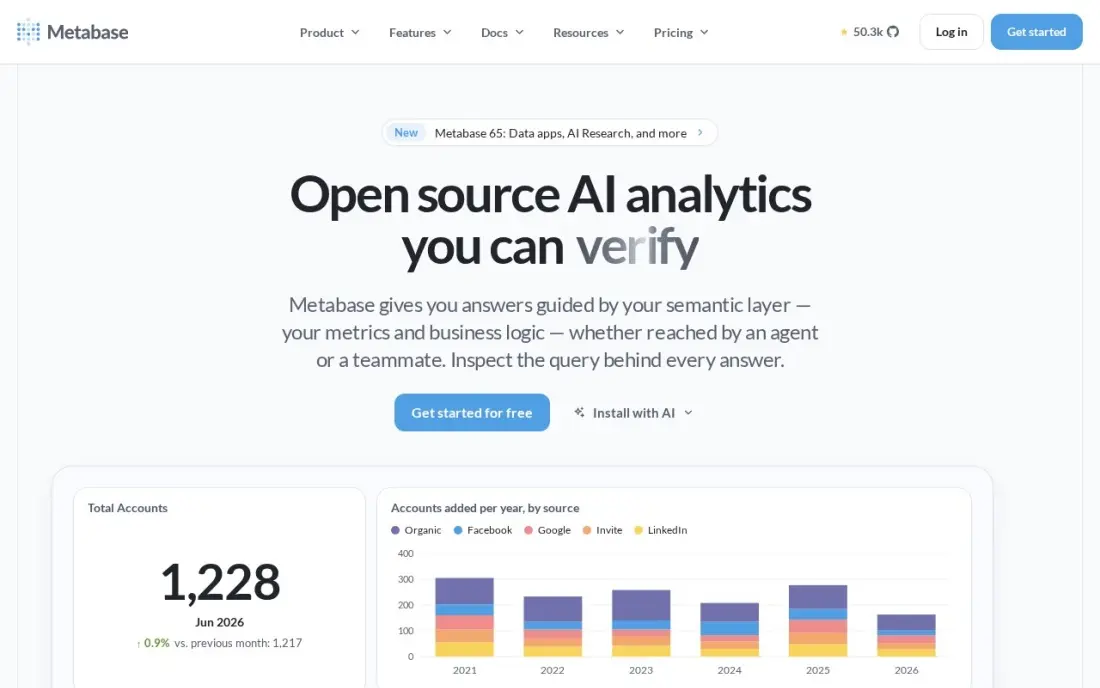
Metabase is the open-source pick. The free edition costs $0 if you self-host it, with no user cap, and the question builder lets non-technical users explore data without writing SQL. Cloud Starter costs $100 a month billed monthly or $90 billed annually for 5 users, with extra users at $6 each, and the hosted version removes the server work entirely.
The price you see is not the whole story: AI features are optional and billed by usage, not included on Starter, and white-label branding needs the Pro plan at $575 a month. Metabase repriced in 2026, so older articles quoting $500 a month for Pro are out of date. For a data team that wants an honest, simple BI tool it can self-host or run in the cloud, Metabase is the pick.
What we like
- A free open-source edition you can self-host with no user cap
- Cloud Starter is $90 a month billed annually for 5 users
- The question builder lets non-technical users explore without SQL
- A clean, fast interface with a small learning curve
Watch out for
- AI features are optional and billed by usage, not included on Starter
- White-label branding needs the Pro plan
- The open-source edition needs your own server and upkeep

ThoughtSpot
Best for: Data teams whose business users want to ask questions in plain English and get charts back
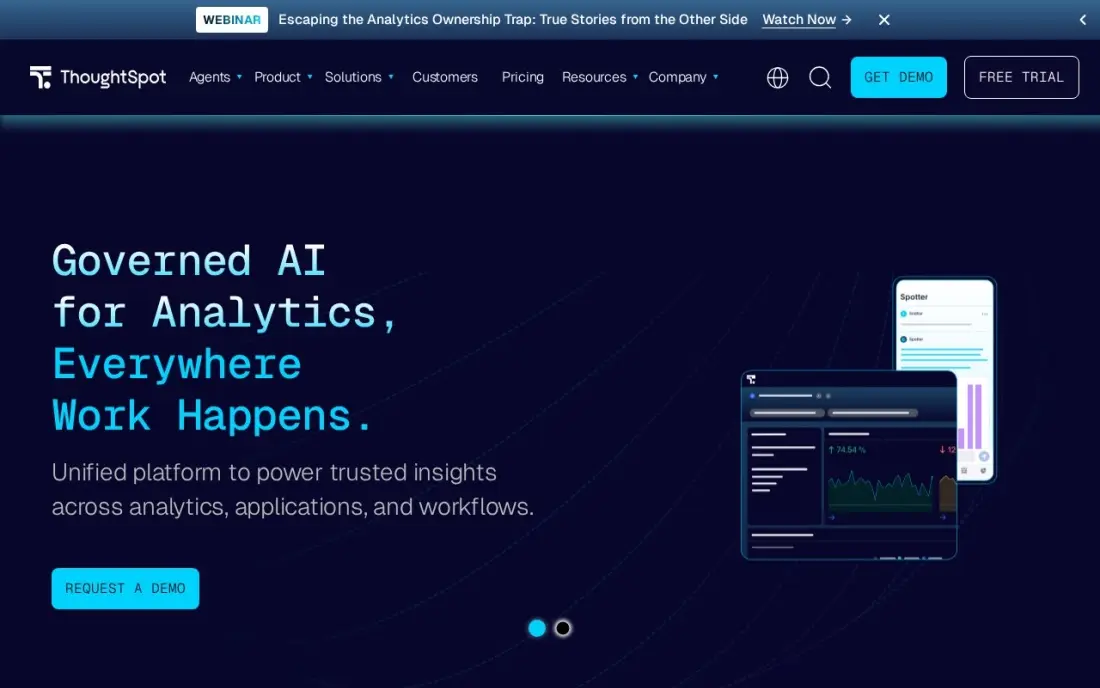
ThoughtSpot is the search-driven pick. Business users type a question in plain English — 'revenue by region last quarter' — and Spotter, the conversational analytics agent, answers with a chart. Liveboards schedule and alert on the numbers that matter, and no SQL is needed for viewers, which makes it the fastest tool here for getting non-technical people to self-serve.
The problem is the price: ThoughtSpot publishes no starting price, so budgeting needs a sales conversation, and third-party figures conflict — old prices of $95 a month and $25 a user a month are still repeated online but no longer match the vendor's page. Embedding is a separate add-on. If your team will actually ask questions in plain English, ThoughtSpot is worth the demo; if not, buy a cheaper tool.
What we like
- Spotter lets business users ask questions in plain English and get charts back
- Search-driven analytics with no SQL needed for viewers
- Liveboard scheduling and alerts keep teams on the same numbers
- Conversational analytics is the core of the product, not an add-on
Watch out for
- No published starting price, so budgeting needs a sales conversation
- Embedding is a separate add-on, not part of the entry plan
- Smaller connector library than Tableau or Power BI

Domo
Best for: Mid-size and enterprise teams that want ETL, warehousing and dashboards in one cloud platform
Domo is the all-in-one: over 1,000 connectors plus ETL, data warehousing and dashboards in a single cloud platform, with AI chat and predictive features built in. Users are unlimited, so viewers do not add licence cost, and the mobile app and alerting system are among the strongest here. For a mid-size team that wants one platform instead of three tools stitched together, Domo is the most complete option.
The catch is the pricing model. Domo charges in consumption credits and publishes no list price, so costs are hard to predict — heavy transforms consume credits and can push the bill up. The 30-day free trial is the way to test it: run your real workloads for a month and ask for the credit usage before you sign. Enterprise features such as Everywhere embedding are add-ons.
What we like
- 1,000+ connectors plus ETL and warehousing in one platform
- Unlimited users, so viewers do not add licence cost
- AI chat and predictive features are part of the platform
- A strong mobile app and alerting system
Watch out for
- Pricing is credit-based and quote-only, so costs are hard to predict
- Heavy transforms consume credits, which can push the bill up
- Enterprise features such as Everywhere embedding are add-ons

Sisense
Best for: SaaS product teams that need to embed white-labeled analytics inside their own application
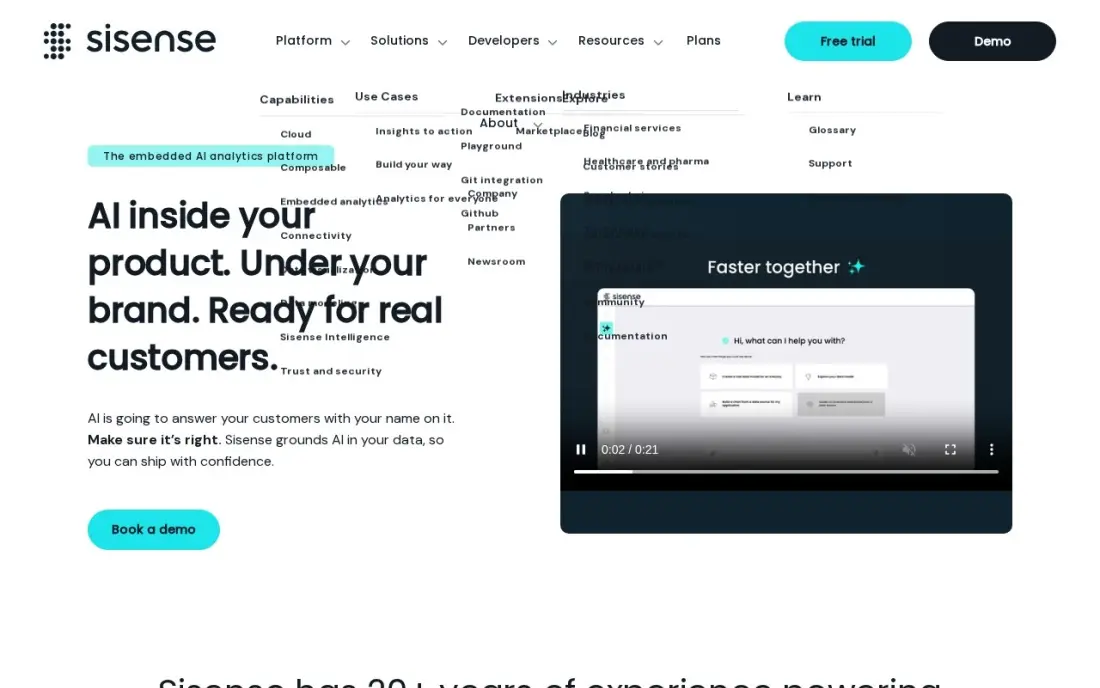
Sisense is the embedded-analytics specialist. If you sell software and need dashboards inside your own product, Sisense's Fusion platform and Compose SDK put white-labelled analytics in front of your customers — white-label branding is included, not an add-on. It handles very large datasets well, and you can run it in the cloud or self-host it, so you control where the data lives.
Sisense removed its list prices on June 1, 2026, so every deal is now a sales conversation and implementation can take weeks. The entry experience is built for developers, not casual business users, and Compose AI is the AI feature on the platform. For a SaaS team embedding analytics in its product, Sisense is the specialist pick; for internal dashboards, a cheaper tool will do.
What we like
- The strongest embedding story here: white-labelled dashboards inside your own product
- Compose AI and the Fusion platform handle complex data models
- Cloud or self-hosted deployment, so you control where data lives
- Good performance on very large datasets
Watch out for
- No published prices since June 1, 2026, so every deal is a sales conversation
- Implementation can take weeks and needs technical setup
- The entry experience is built for developers, not casual business users

Looker
Best for: Enterprises that need one governed semantic layer (LookML) behind every dashboard
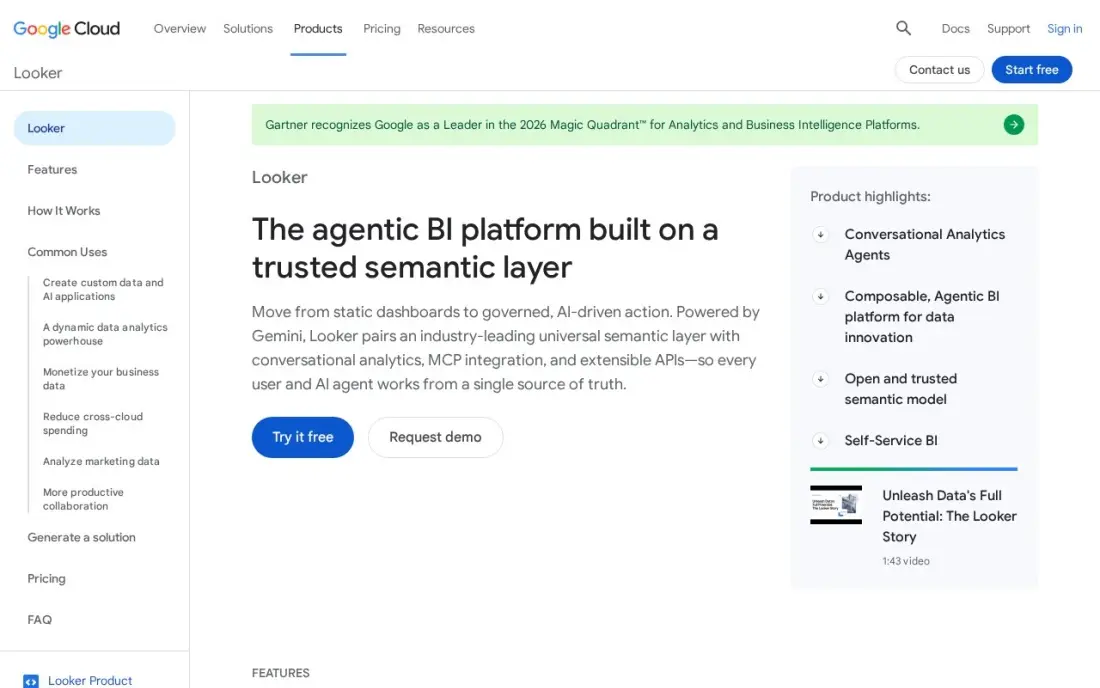
Looker is the governance pick. Its LookML semantic layer defines each metric once — revenue, churn, active users — so every dashboard in the company shows the same number. Gemini in Looker adds AI summaries and natural-language queries, and the platform pulls real-time data from BigQuery and other Google Cloud sources. For an enterprise that has suffered from two teams reporting different numbers, Looker fixes the root cause.
The price is a custom quote on every plan, and embedding needs the Enterprise plan or an add-on. LookML has a real learning curve for new authors, and the platform assumes you already run on Google Cloud. Do not confuse it with Looker Studio, Google's free dashboard tool — they share a name and little else. If governance is your top priority, Looker is the pick; otherwise, start cheaper.
What we like
- LookML defines each metric once, so every dashboard agrees on the number
- Gemini in Looker brings AI summaries and natural-language queries
- Real-time data from BigQuery and other Google Cloud sources
- Strong governance, versioning and access control
Watch out for
- No published price; every plan is a custom quote
- Embedding needs the Enterprise plan or an add-on
- LookML has a real learning curve for new authors
The best data visualization platform for analytics is the one your team will actually open every morning. We compared 12 platforms on price, free plans, refresh speed and AI features, checking every price on the vendor's own pricing page on November 12, 2026.
How to choose the best data visualization platform for analytics
- Price by the unit you will actually pay for: per user (Tableau, Power BI), flat per month (Qlik, Klipfolio) or a custom quote (ThoughtSpot, Domo, Sisense, Looker).
- Data sources: check your database, warehouse and SaaS tools are on the connector list before you pay.
- Refresh speed: daily updates are the entry-plan standard here, but some plans refresh hourly and others every 4 hours.
- Governance: if two departments must agree on one number, you need a governed layer such as LookML or Qlik's shared model.
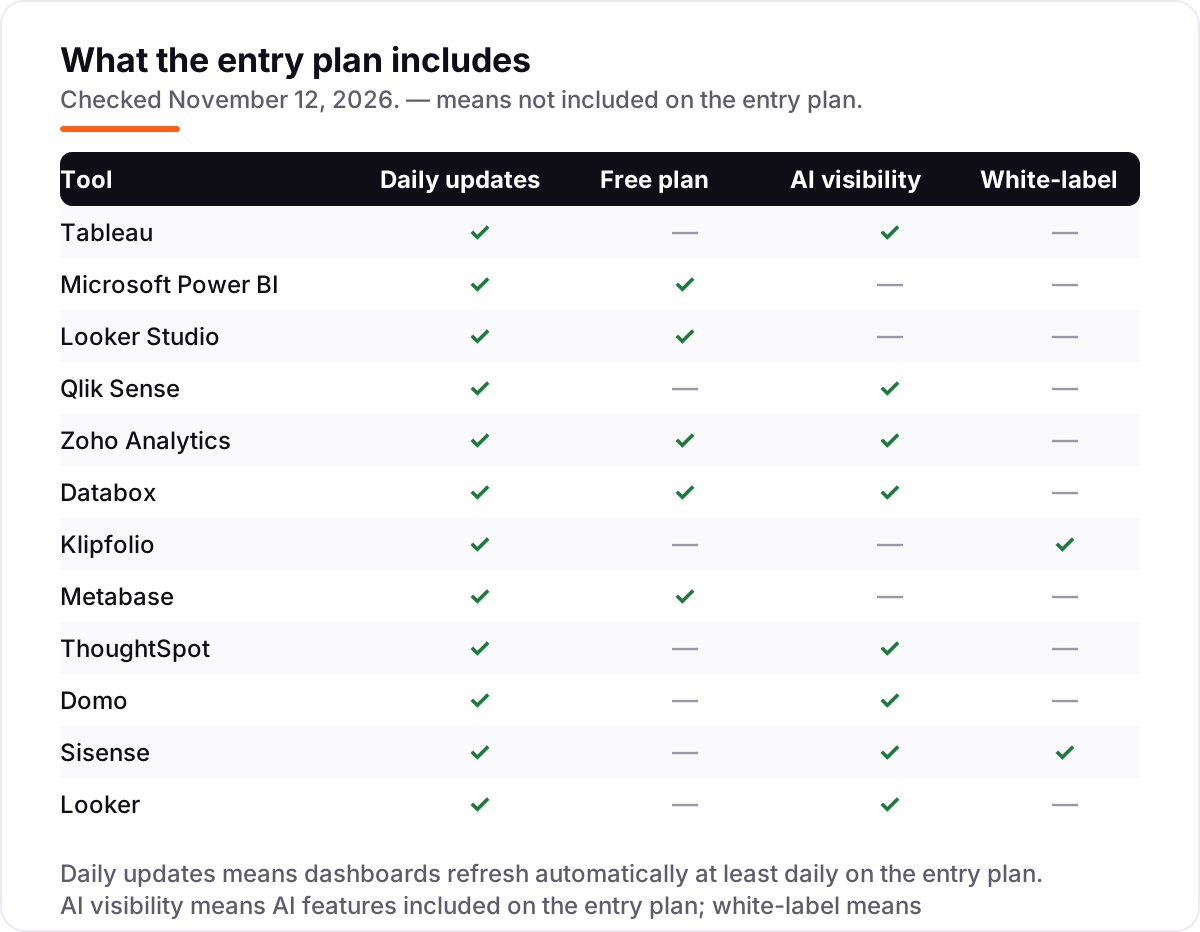
- AI help: an AI assistant is included on the entry plan for Tableau, Qlik, Zoho, Databox, ThoughtSpot, Domo, Sisense and Looker, but not for Power BI, Looker Studio, Klipfolio or Metabase.
- Embedding and white-label: only Klipfolio and Sisense include white-label branding on the entry plan; the rest charge extra or need a higher tier.
If the dashboard is for a local business — a clinic, a trades company, a multi-location retailer — the numbers only matter if new customers can find you, so read our local SEO guide alongside this one. Before you share a dashboard publicly, check how the page that embeds it will look in search with the free SERP snippet preview tool.
Data visualization platform for analytics pricing: what you will actually pay
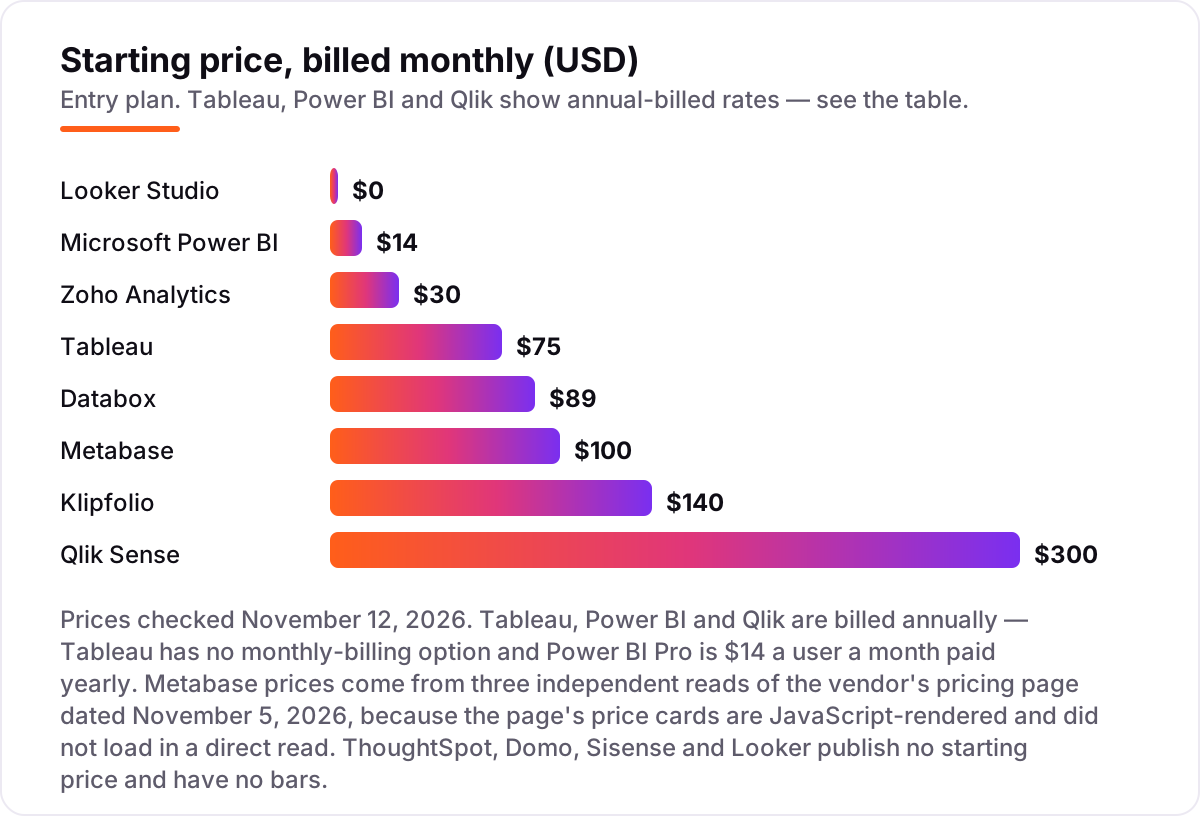
The sticker price is rarely the bill. Here is what a 10-person team — one author and nine viewers, where the tool charges per role — would pay each month on the cheapest path, using the prices in the cards above.
- Microsoft Power BI: 10 × $14 Pro = $140 a month, paid yearly ($1,680 a year).
- Tableau: 1 Creator at $75 + 9 Viewers at $15 = $210 a month, billed annually ($2,520 a year).
- Looker Studio: $0 on the free plan. Pro would be 10 × $9 = $90 a month per project ($1,080 a year).
- Qlik Sense: $300 a month flat — Starter covers exactly 10 users ($3,600 a year).
- Zoho Analytics: Standard is $48 a month billed annually for 5 users, plus 5 extra users at $6.40 each = $80 a month ($960 a year). The $6.40 add-on price comes from an independent read of Zoho's pricing page, not a direct read.
- Databox: Analyst covers 1 user, so a 10-person team needs Team Scale at $319 a month billed annually ($3,828 a year).
- Klipfolio: $120 a month billed annually, unlimited users — the same whether you have 3 people or 30 ($1,440 a year).
- Metabase: Starter is $100 a month for 5 users, so 10 users cost $130 a month on monthly billing — $100 + 5 × $6 ($1,560 a year).
- ThoughtSpot, Domo, Sisense and Looker: no published price. Budget a sales conversation and ask for the price per user, per credit or per embedded view before you commit.
The pattern is clear: flat-priced tools (Qlik, Klipfolio) are the easiest to budget, per-user tools (Power BI, Tableau) stay cheap while the team is small, and quote-only tools are the ones where the real cost only appears after a demo.
Know the difference: Looker Studio vs Looker
Google sells two tools with nearly the same name, and the confusion is real — the G2 review page for Looker even mixes in reviews from Looker Studio users. Looker Studio is the free dashboard tool: $0, unlimited reports, built for reporting on Google data. Looker is the enterprise platform: a governed semantic layer (LookML) where every metric is defined once, priced by custom quote. If you need a dashboard this week, you want Looker Studio. If you need every department to agree on what "revenue" means, you want Looker — and a sales call first.
The same confusion applies to pricing units. Per-user tools (Tableau, Power BI, Zoho, Metabase) charge for every author and viewer, so the bill grows with the team. Flat tools (Qlik Sense, Klipfolio) charge one monthly price no matter how many people look. Quote-only tools (ThoughtSpot, Domo, Sisense, Looker) charge by usage, credits or embedded views, so the only honest budget is the quote itself. Pick the unit first, then the tool.
Quick comparison: tool type by need
| If you need | Best fit | From |
|---|---|---|
| Free dashboards for Google data | Looker Studio | $0 |
| Cheapest per-user paid plan | Microsoft Power BI | $14/user/mo |
| Deepest visual analytics | Tableau | $75/user/mo |
| Flat price for 10 people | Qlik Sense | $300/mo |
| Flat price, unlimited viewers | Klipfolio | $120/mo |
| Free open-source BI | Metabase | $0 (self-hosted) |
| AI assistant on a budget | Zoho Analytics | $24/mo |
| KPI dashboards for clients | Databox | $71/mo |
| Ask questions in plain English | ThoughtSpot | Custom quote |
| All-in-one ETL + dashboards | Domo | Custom quote |
| Embedded analytics in your app | Sisense | Custom quote |
| One governed metric layer | Looker | Custom quote |
Mistakes to avoid
- Buying per-user licences for viewers who only need a weekly PDF. Check the Viewer or free tier first — Tableau charges $15 a month per viewer, while Looker Studio viewers are free.
- Paying for a quote-only platform before checking the free and flat-priced options. Four tools here publish no price, so a demo can cost weeks before you know the number.
- Ignoring the refresh rate. A dashboard that updates once a day is fine for a weekly report and useless for a live sales floor — check the plan's refresh schedule before you buy.
- Choosing on chart style alone. The prettiest chart is worthless if your data source is not on the connector list, so connect your real data during the trial.
- Skipping the governance question. If two teams report different revenue numbers, no chart will fix it — that is a semantic-layer problem, not a visualisation problem.
How we chose
We checked every price on the vendor's own pricing page on November 12, 2026, and every rating on the tool's G2 reviews page on the same date. Two prices need a note: Metabase's pricing page is JavaScript-rendered, so its $100 a month (monthly billing) and $90 a month (billed annually) figures come from three independent reads of that page dated November 5, 2026, which all agree; and Zoho's $6.40 per extra user comes from an independent read of Zoho's pricing page. ThoughtSpot, Domo, Sisense and Looker publish no starting price, so we list them as custom quote rather than repeating third-party estimates — several published figures conflict, including old ThoughtSpot prices of $95 a month and $25 a user a month that no longer match the vendor's page. G2 review counts drift between pages, so we used the freshest reviews-page count for each tool. Zoho Analytics and Microsoft Power BI show no rating here: their G2 counts were 8 days old, outside our freshness window, so we left them blank rather than print a stale score. We ranked by a mix of price, free plan, connector breadth, AI features and governance, not by rating alone.
What to do next
Start with the free options: build one dashboard in Looker Studio and one in the free tier of Databox or Zoho Analytics, using your real data, and see which one your team opens without being asked. If the free tools fall short, trial Power BI Pro for 60 days or Tableau for 14 days before you commit to a per-user bill. For the quote-only tools, book the demo with your data volume and user count in hand so the first quote is a real number — and if the dashboard shows your traffic is the problem, our monthly SEO service can work on the rankings behind the numbers. Once your tools are in place, find out what's holding your rankings back.
Frequently asked questions
What is the best data visualization platform for analytics in 2026?
There is no single best choice — it depends on budget and team size. Tableau leads for depth at $75 per Creator a month, Microsoft Power BI is the best-value paid plan at $14 a user a month, and Looker Studio is the best free option at $0. Qlik Sense covers 10 users for $300 a month. Start with the free tools, pay only for the features your team uses.
How much does a data visualization platform cost?
Prices in this list run from $0 (Looker Studio, Metabase open source) to $300 a month (Qlik Sense Starter). Per-user plans cost $14 to $75 a user a month, and flat plans cost $120 to $300 a month. Four tools — ThoughtSpot, Domo, Sisense and Looker — publish no price, so expect a custom quote. For a 10-person team, the paid path is Power BI Pro at $140 a month.
Is there a free data visualization platform?
Yes. Looker Studio is free with unlimited reports and no user cap, and it is the strongest free option for Google data. Metabase's open-source edition is also free if you self-host it. Databox and Zoho Analytics both offer free plans with limited users and data sources. Microsoft Power BI offers a free account for building locally, but sharing reports needs the $14 Pro licence.
What is the difference between Looker Studio and Looker?
Looker Studio is Google's free dashboard tool for reporting on GA4, Google Ads and other data — it costs $0, and Pro is $9 a user per project a month. Looker is Google's enterprise analytics platform built on LookML, a governed semantic layer that defines each metric once. It is priced by custom quote. Google renamed Looker Studio back to Data Studio in April 2026, which adds to the confusion.
Should I choose per-user or flat pricing?
Choose per-user pricing (Power BI, Tableau, Zoho, Metabase) when the team is small and a few people build dashboards — Power BI Pro is $14 a user a month. Choose flat pricing (Qlik Sense at $300 a month for 10 users, Klipfolio at $120 a month for unlimited users) when many people need to view dashboards, because viewers do not add cost. Quote-only tools suit larger teams with complex data.
Can I switch data visualization platforms later?
Yes, but switching is slower than starting over. Dashboards do not transfer between platforms, so you will rebuild every chart and report. What does transfer is your data model — the cleaned tables and definitions — so build those in your warehouse or database first. Trial two tools with the same real dataset for two weeks before you commit, and check the export and connector options before you pay.
Sources we checked (22)
- Tableau pricing — www.tableau.com/en-gb/pricing/cloud (checked November 12, 2026)
- Tableau on G2 — 4.4/5, 4,237 reviews (checked November 12, 2026)
- Microsoft Power BI pricing — www.microsoft.com/en-us/power-platform/products/power-bi/pricing (checked November 12, 2026)
- Looker Studio pricing — cloud.google.com/looker-studio (checked November 12, 2026)
- Looker Studio on G2 — 4.4/5, 477 reviews (checked November 12, 2026)
- Qlik Sense pricing — www.qlik.com/us/pricing (checked November 12, 2026)
- Qlik Sense on G2 — 4.4/5, 929 reviews (checked November 12, 2026)
- Zoho Analytics pricing — www.zoho.com/analytics/pricing.html (checked November 12, 2026)
- Databox pricing — databox.com/pricing (checked November 12, 2026)
- Databox on G2 — 4.4/5, 194 reviews (checked November 12, 2026)
- Klipfolio pricing — www.klipfolio.com/pricing (checked November 12, 2026)
- Klipfolio on G2 — 4.5/5, 257 reviews (checked November 12, 2026)
- Metabase pricing — www.metabase.com/pricing (checked November 12, 2026)
- Metabase on G2 — 4.4/5, 147 reviews (checked November 12, 2026)
- ThoughtSpot pricing — www.thoughtspot.com/pricing (checked November 12, 2026)
- ThoughtSpot on G2 — 4.4/5, 340 reviews (checked November 12, 2026)
- Domo pricing — www.domo.com/pricing (checked November 12, 2026)
- Domo on G2 — 4.3/5, 1,086 reviews (checked November 12, 2026)
- Sisense pricing — www.sisense.com/pricing (checked November 12, 2026)
- Sisense on G2 — 4.2/5, 1,088 reviews (checked November 12, 2026)
- Looker pricing — cloud.google.com/looker/pricing (checked November 12, 2026)
- Looker on G2 — 4.4/5, 1,748 reviews (checked November 12, 2026)
Make one of these tools?
We re-check this list every quarter. Send a correction, request a review, or ask about a clearly labeled sponsored spot.
Request a listingShamim
Founder of SerpAstra
A full-stack SEO and digital marketer who spends most days on Local SEO for dental practices, AI search visibility and lead generation.
Free SEO and AI visibility audit
Find out what is holding your rankings back
Send us your site. Within 2 business days you get a written audit, an AI visibility check and a short fix list ranked by impact. Free, with no contract attached.
Request my free audit→Related buying guides
 Data, Analytics & AI10 Best BI Software for Analytics in 2026, ComparedThe 10 best BI software for analytics compared on real 2026 prices, free plans and G2 ratings, so you can pick the right dashboard tool for your team.Read guide →
 Data, Analytics & AI12 Best Dashboard Software for Data Analytics in 2026, ComparedCompare the 12 best dashboard software for data analytics on price, free plans, AI features and refresh speed, with every price checked November 7, 2026.Read guide →
 Data, Analytics & AI12 Best Analytics Software in 2026: Pricing, Features and Pros & ConsThe 12 best analytics software tools for 2026, compared on price, free plans and what each one measures, with every price checked on the pricing page.Read guide →